Star Light, Star Bright, What is Your Visual Magnitude Tonight?
- Apr 24, 2017
- Tech Tip
- Space Situational Awareness
-
 EOIR
EOIR
April 29th is International Astronomy Day, and we'll be outside, hoping for a clear night to see a sky full of stars. These brilliant sources of light have been observed for centuries. But how bright are these stars? If you wanted to know before you would have to take a catalog, a camera, and go out on a perfect night to capture the perfect picture. These days we don’t have to go outside to make our measurements.

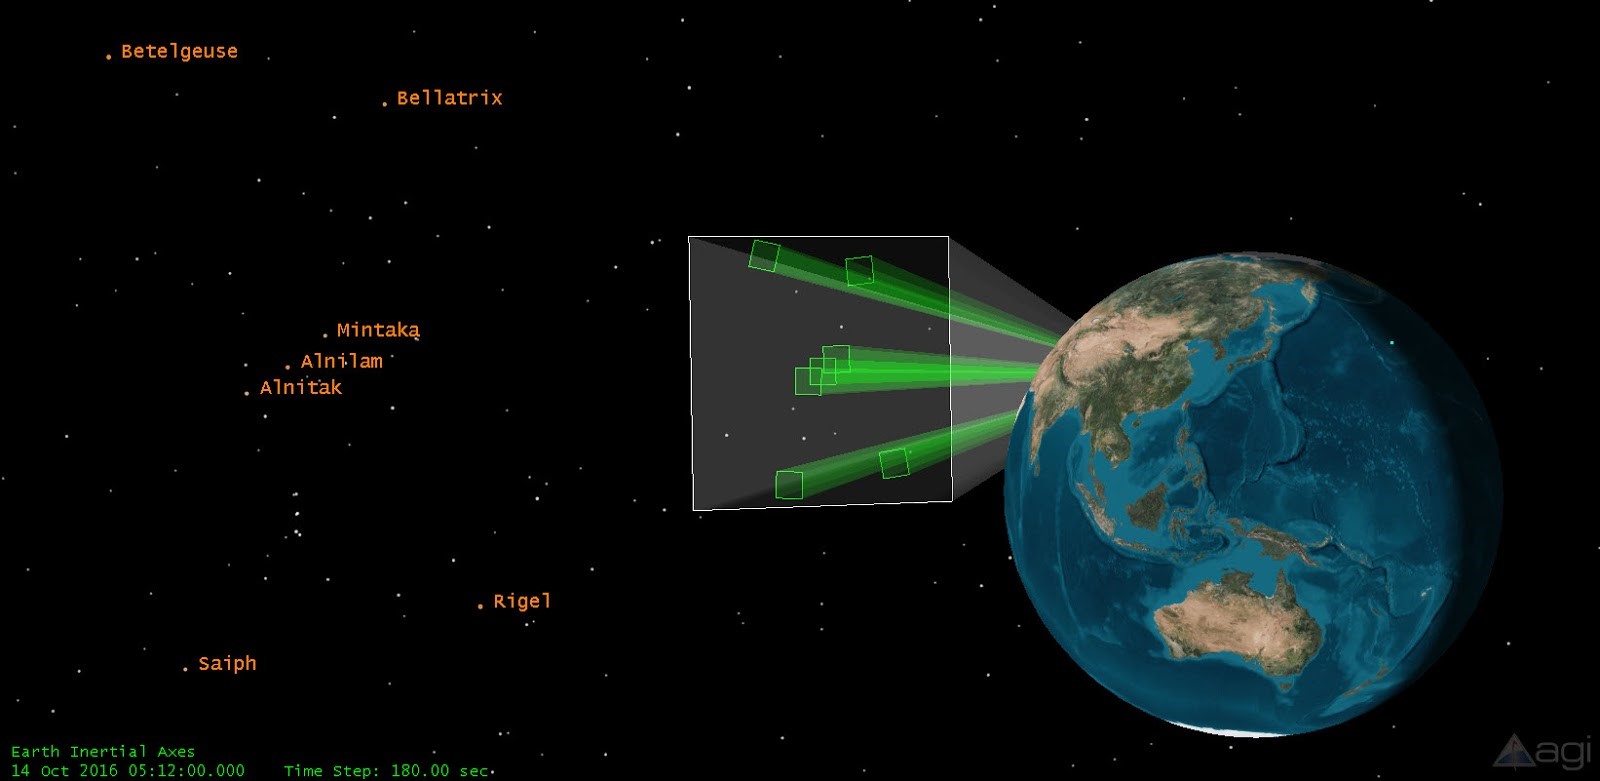
Systems Tool Kit (STK) with the Electro-Optical Infrared (EOIR) plugin tool can model the behaviors of sensors and measure various characteristics of stars. STK and EOIR have a plethora of capabilities and we will cover a sliver of them for this analysis, specifically features related to measuring the visual magnitude of stars.
We need to first understand visual magnitude (vMag). When a telescope or sensor looks up at the sky, the brightness of the objects it’s looking at is called apparent magnitude. If we’re only considering what the human eye can see, then we’re measuring visual magnitude. This is a relative measurement on a log scale. It’s a ratio of the irradiance (which is the energy of the source over a given area) of one object to another reference object. For stars, imagine the far away bright burning object viewed as a tiny pinprick in the sky. This means when we’re measuring the visual magnitude we’re actually measuring the signal from a source object and because not every sensor responds the same, the atmosphere is always in the way, we need to establish a baseline for our measurements.
We establish a baseline by measuring a known object. We need to know the visual magnitude of the object we’re measuring, that way we can check to see how well our detectors are measuring a known signal. The most common star that is used for reference is Vega, but we can also use another known bright source in our field of view, or multiple known (less bright) sources in the field of view. The method can change, but we will use the same formula and calibration steps to complete our analysis.

How to get started:
Let’s bring in our telescopes and lawn chairs and take a quantitative approach to talking about bright stars. Star brightness isn’t the technical term, we mean visual magnitude (vMag) and irradiance (E) of the star. We will use vMag and E as the visual magnitude and irradiance of the object of interest and vRef and ERef as the visual magnitude and irradiance of a reference object respectively.
Alternatively, we can measure the signal from the image itself. Using this technique we’ll look at the raw data from the EOIR synthetic scene and we’ll use the measured signal (sRef) of our object of interest in our formula. The conversation between the irradiance is discussed in the full report of this analysis in Part II.
Equation (2): vMag= vRef - 2.5 *log10 (s/sRef)
Regardless of which equation we use, we expect our results to be the same. But we’re jumping ahead of ourselves. Let’s take a look at our STK scenario.

We mentioned that there are three approaches we can use:
- Measure Vega
- Measure another bright source
- Measure multiple sources
It doesn’t matter which method we choose, we first need to calibrate to our reference star or stars. We’ll use the vRef value we find in our textbooks (Vega has a vRef= 0.03) and use EOIR to measure the ERef which we’ll read off of our details panel. We can also export the raw data and get the sRef value.
From this simulated image we can see a single star shining brightly in the center of the synthetic scene. Because we’re using a simulator we can look at the details and see what the in-band entrance aperture irradiance value is for our star:

Once we have our reference value, all we need to do is fill in the equation with our calibrated terms and measure more stars. Wanna try it yourself? Then check out Part II: Shining a Light on Visual Magnitude for a complete analysis of these calibration methods.
What’s next?:
Do you want to do your own analysis or have questions on how we did ours? Check out Part II: Shining a Light on Visual Magnitude.
And remember to send your STK and EOIR questions to support@agi.com!
